Getting Started
It only takes a few minutes to set up ExperimentPilot. In this tutorial, we will register a simple survey experiment with sequential blocking in ExperimentPilot and connect it to Qualtrics.
1. Sign Up
You must first create an account to use ExperimentPilot. Once your account is created, you can log in.
2. Register Your Experiment
Upon login, you will be brought to your ExperimentPilot dashboard. The dashboard provides all functionality to manage your adaptive experiments. Here, you can register new experiments and monitor the progress of running experiments.
If you are new to ExperimentPilot, the dashboard will be empty. To register your first experiment, click on Register Experiment (or the New button in the dashboard sidebar). Provide the required information about your experiment in the registration form:
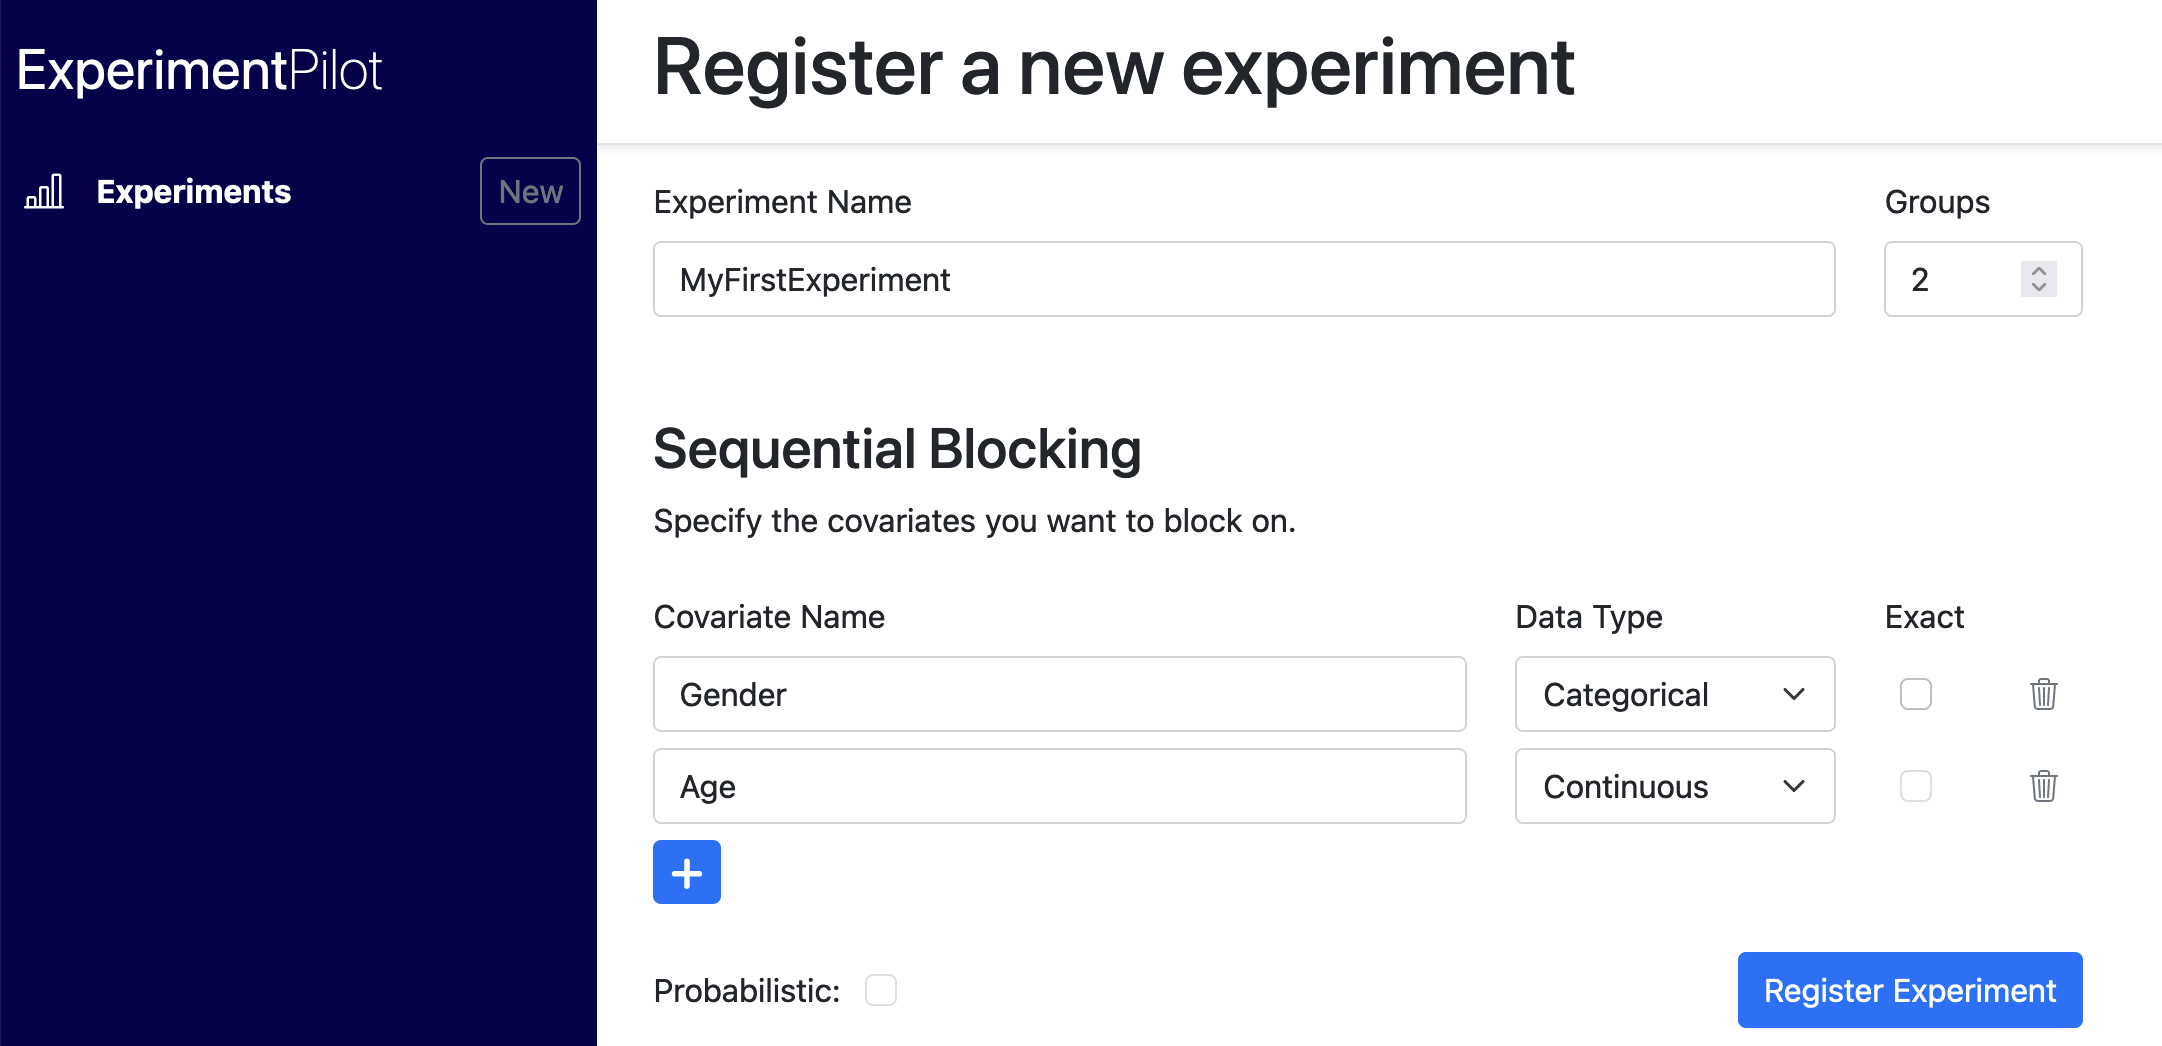
- Experiment Name: A name to identify your experiment.
- Groups: The number of experimental groups in your experiment. This number must include the control group, so the minimum allowed number is 2.
- Covariates: The covariates you want to block on. You need to provide the name of the covariate and if the covariate is categorical or continuous. If your covariate is categorical, you can also decide if you want to do exact blocking on the covariate. You can add covariates by clicking the plus button. Note that covariate names are not case-sensitive. You can learn more about the sequential blocking methods implemented in ExperimentPilot here.
For this tutorial, let us assume we want to block on two covariates, gender and age (see the image below). Once you are satisfied with your specification, you can click the Register Experiment button.
3. Verify Experiment Details
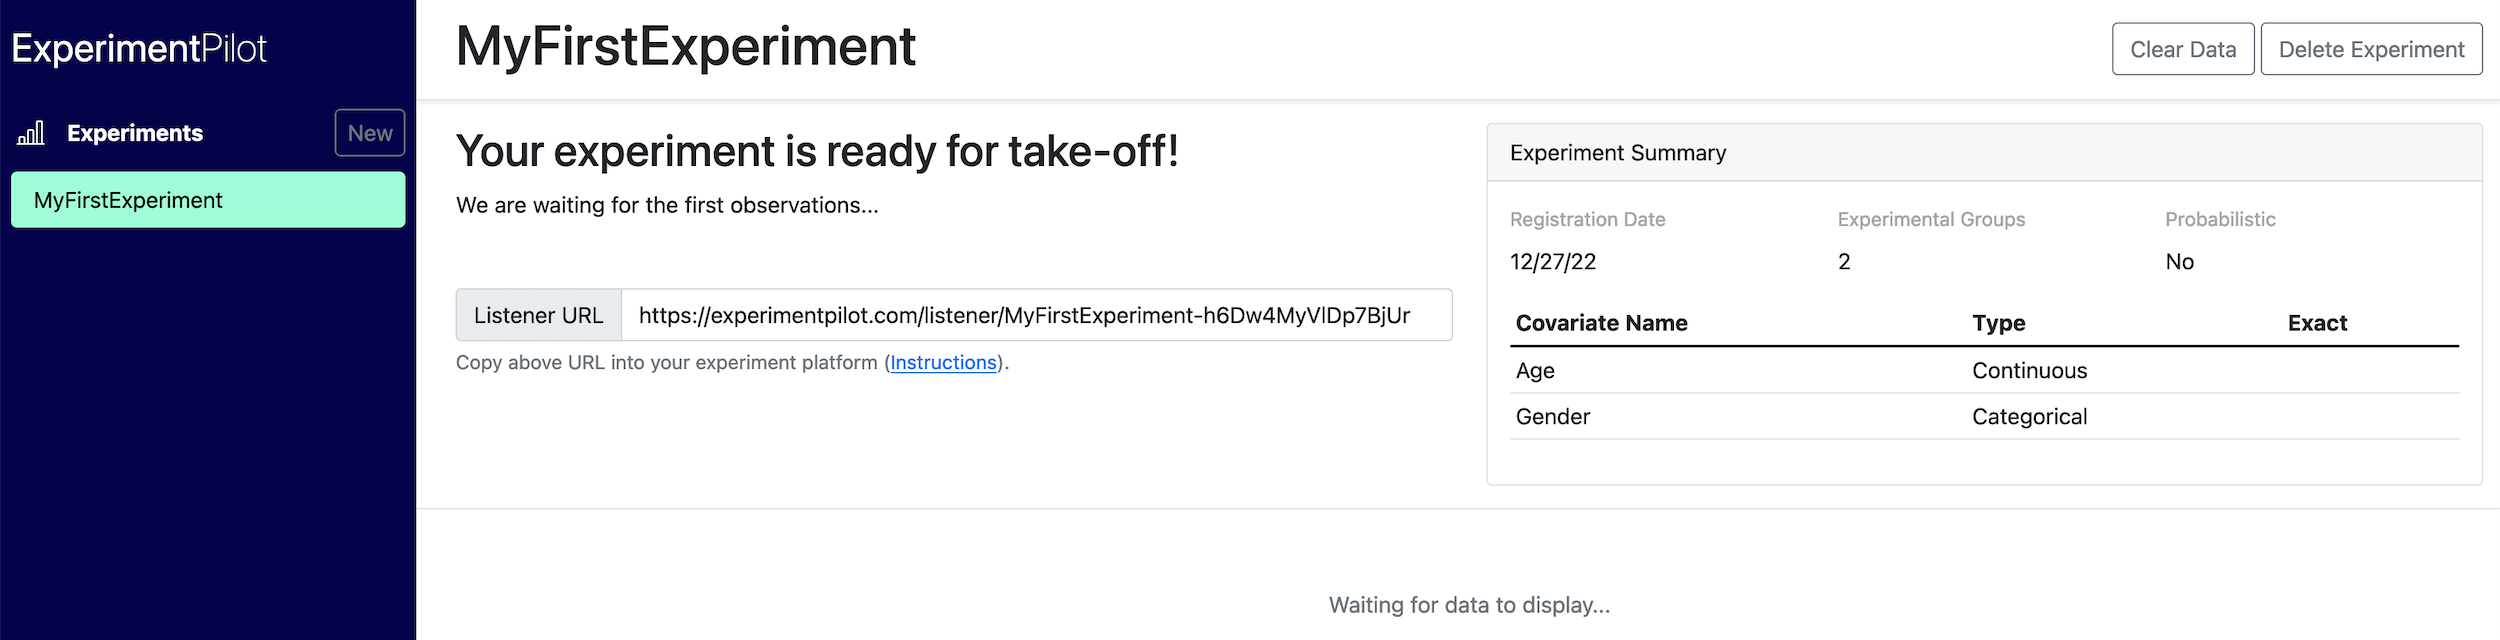
Once your experiment is successfully registered, you are redirected to the experiment page. The experiment page lets you manage and monitor your experiment. The page displays several key pieces of information.
- Listener URL: The unique URL through which ExperimentPilot interfaces with your experiment platform.
- Experiment Summary: The details of your registered experiment.
Before moving on, make sure the experiment details are correct. If you made a mistake during registration, you can click on Delete Experiment in the top right corner to delete the experiment and then create a new one with the desired specification. In our case, the summary correctly displays the two covariates we want to block on.
4. Link To Experiment Platform
You can now embed the listener URL into your experiment platform of choice. Details on how to do this differ across platforms, but any platform that can send and process html requests and responses can be used with ExperimentPilot. In this tutorial, we use Qualtrics, a popular platform for running survey experiments.
-
Start by setting up your survey questions and survey flow as you usually would. For this tutorial, we first
collect the two demographic covariates we want to block on and then add an experimental component, where a
different text is displayed to the user depending on the experimental group they are in.
Recommendation: Use proper validation for survey responses. For instance, ExperimentPilot expects numeric values for continuous covariates (if responses cannot be coerced to numeric, ExperimentPilot performs unconditional randomization), so for the age question, we restrict responses to integers between 18 and 100.
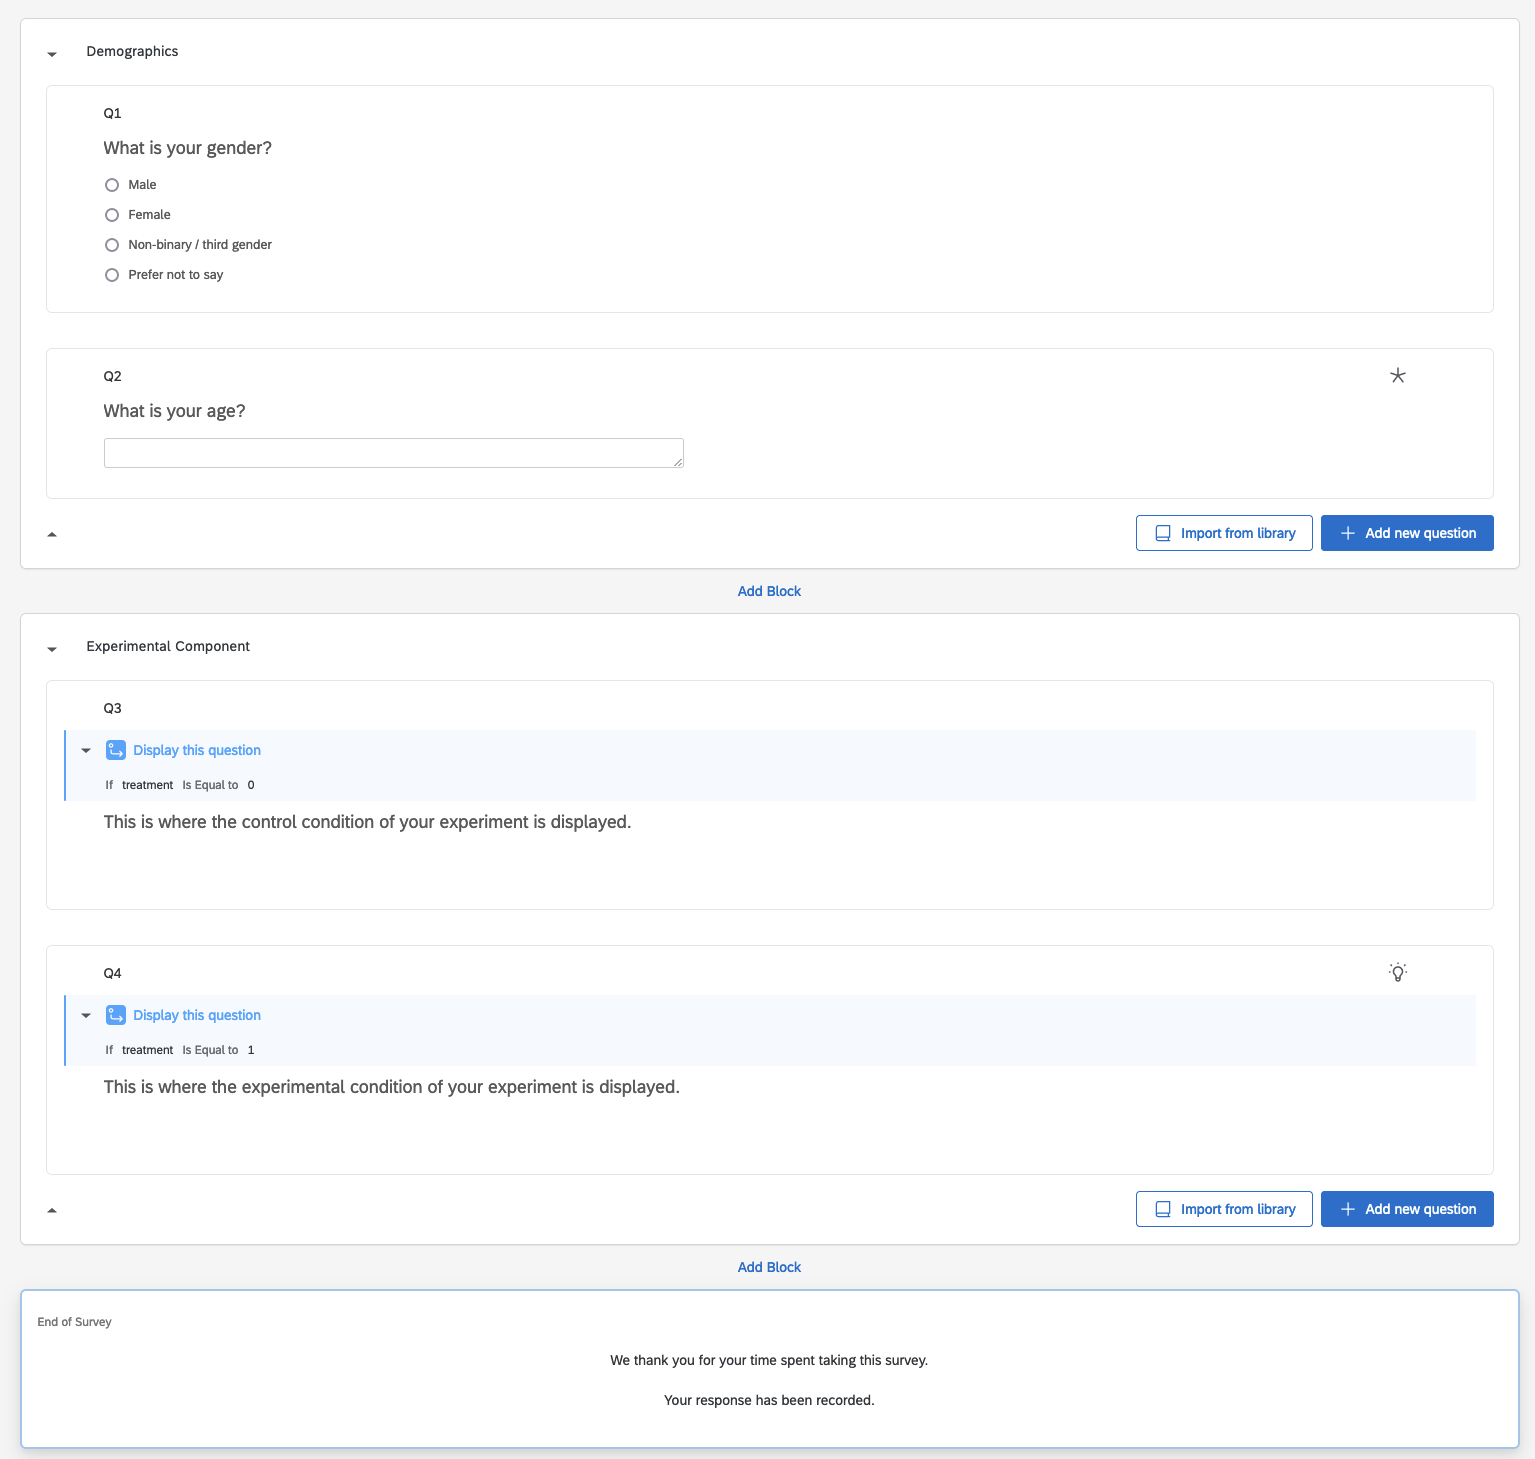
Questionnaire -
The treatment condition used in the display logic is obtained from ExperimentPilot. The treatment takes a value
from 0 to the number of experimental groups minus 1. To set it, we must
configure the survey flow to interface with ExperimentPilot. Open the survey flow page in Qualtrics. At some
point in the flow after you have collected all covariates you want to block on, but before the experimental
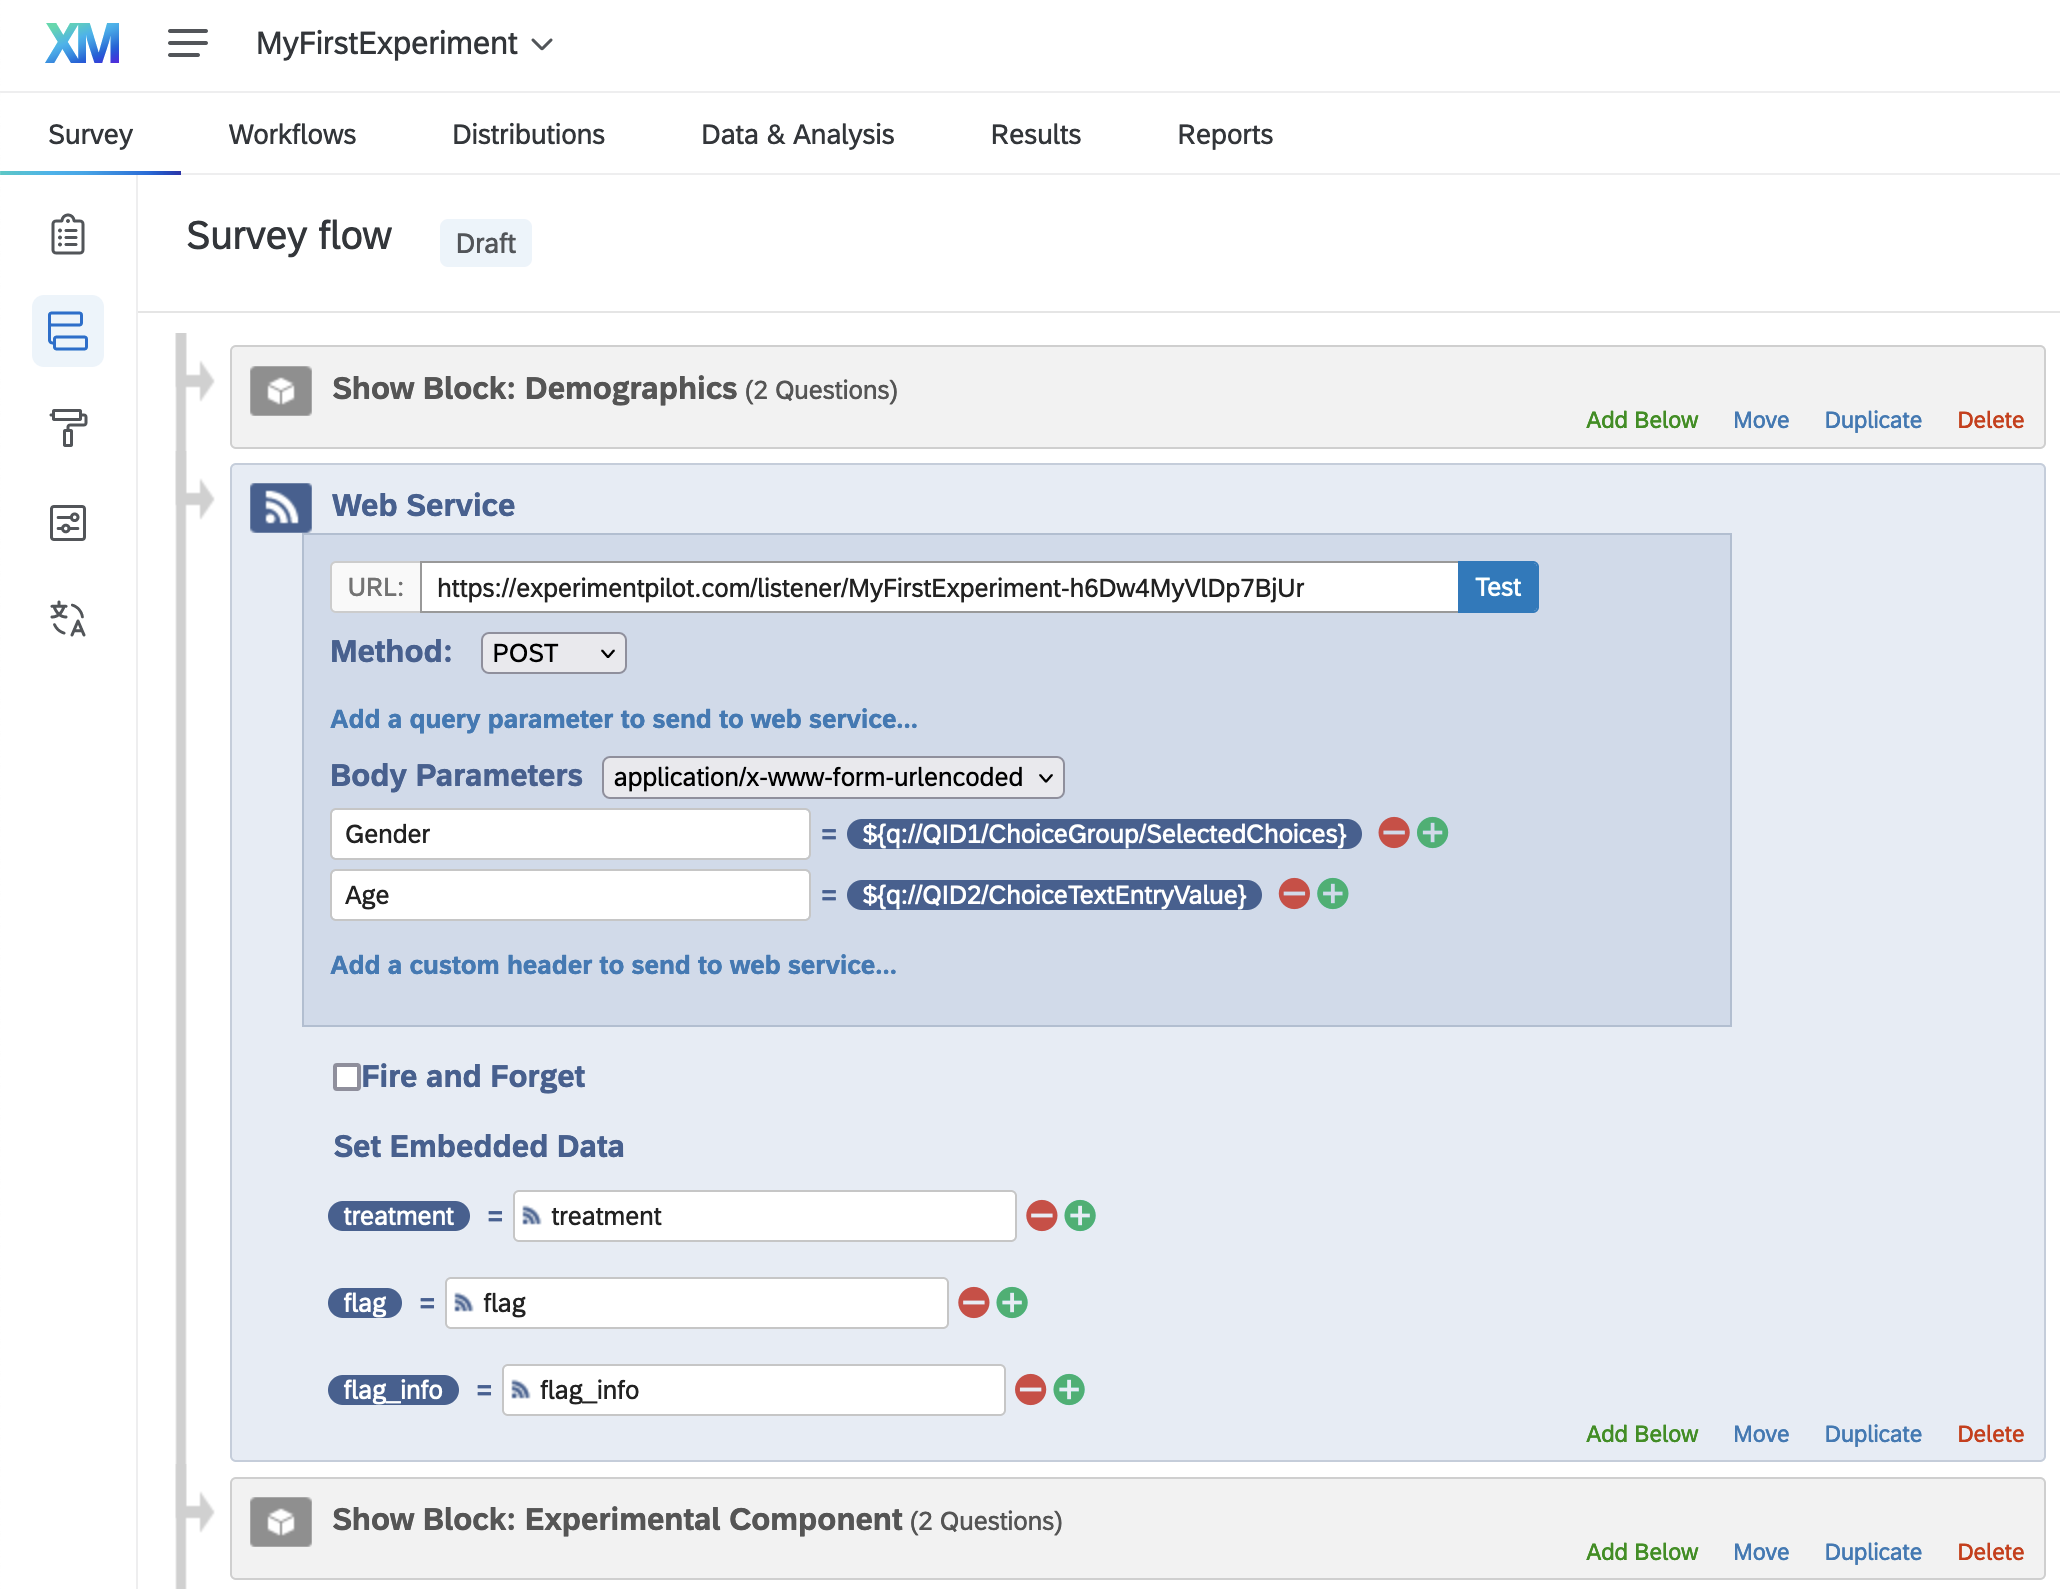
component, add a web service component. Fill the component as follows:
- URL: Enter the ExperimentPilot listener URL.
- Method: You can use either the GET or the POST method, but we recommend the POST method. If you choose the POST method, next click on "Add a body parameter to send to web service...".
- Body Parameters: ExperimentPilot supports application/x-www-form-urlencoded and application/json content types. For simplicity, we recommend choosing the pre-selected application/x-www-form-urlencoded content type. Now you can add the covariates you registered in ExperimentPilot. In the "Parameter to Web Service..." field, type the covariate name as specified in ExperimentPilot. Click on "Set a Value Now", then "Insert Piped Text", then "Survey Question" and then select the question corresponding to the covariate. Choose "Selected Choices" if using a choice question or the question itself in case of a text entry question.
- Fire and Forget: Make sure the fire and forget field is unchecked.
-
Set Embedded Data: The embedded data records the response from the
ExperimentPilot server.
First, record the treatment assigned by ExperimentPilot. Click on "Set a Value Now" and provide a name
for the variable holding the treatment response. This can be any name you want, we choose "treatment" in
the example below. On the right of the equal sign, in the "Field From Web Service..." field, also write
"treatment". This name should not be modified!
Optional: We recommend setting two more embedded data variables for trouble-shooting your experiment setup: "flag" and "flag_info" (see image below). We discuss their purpose in the next section.
Web Service Component -
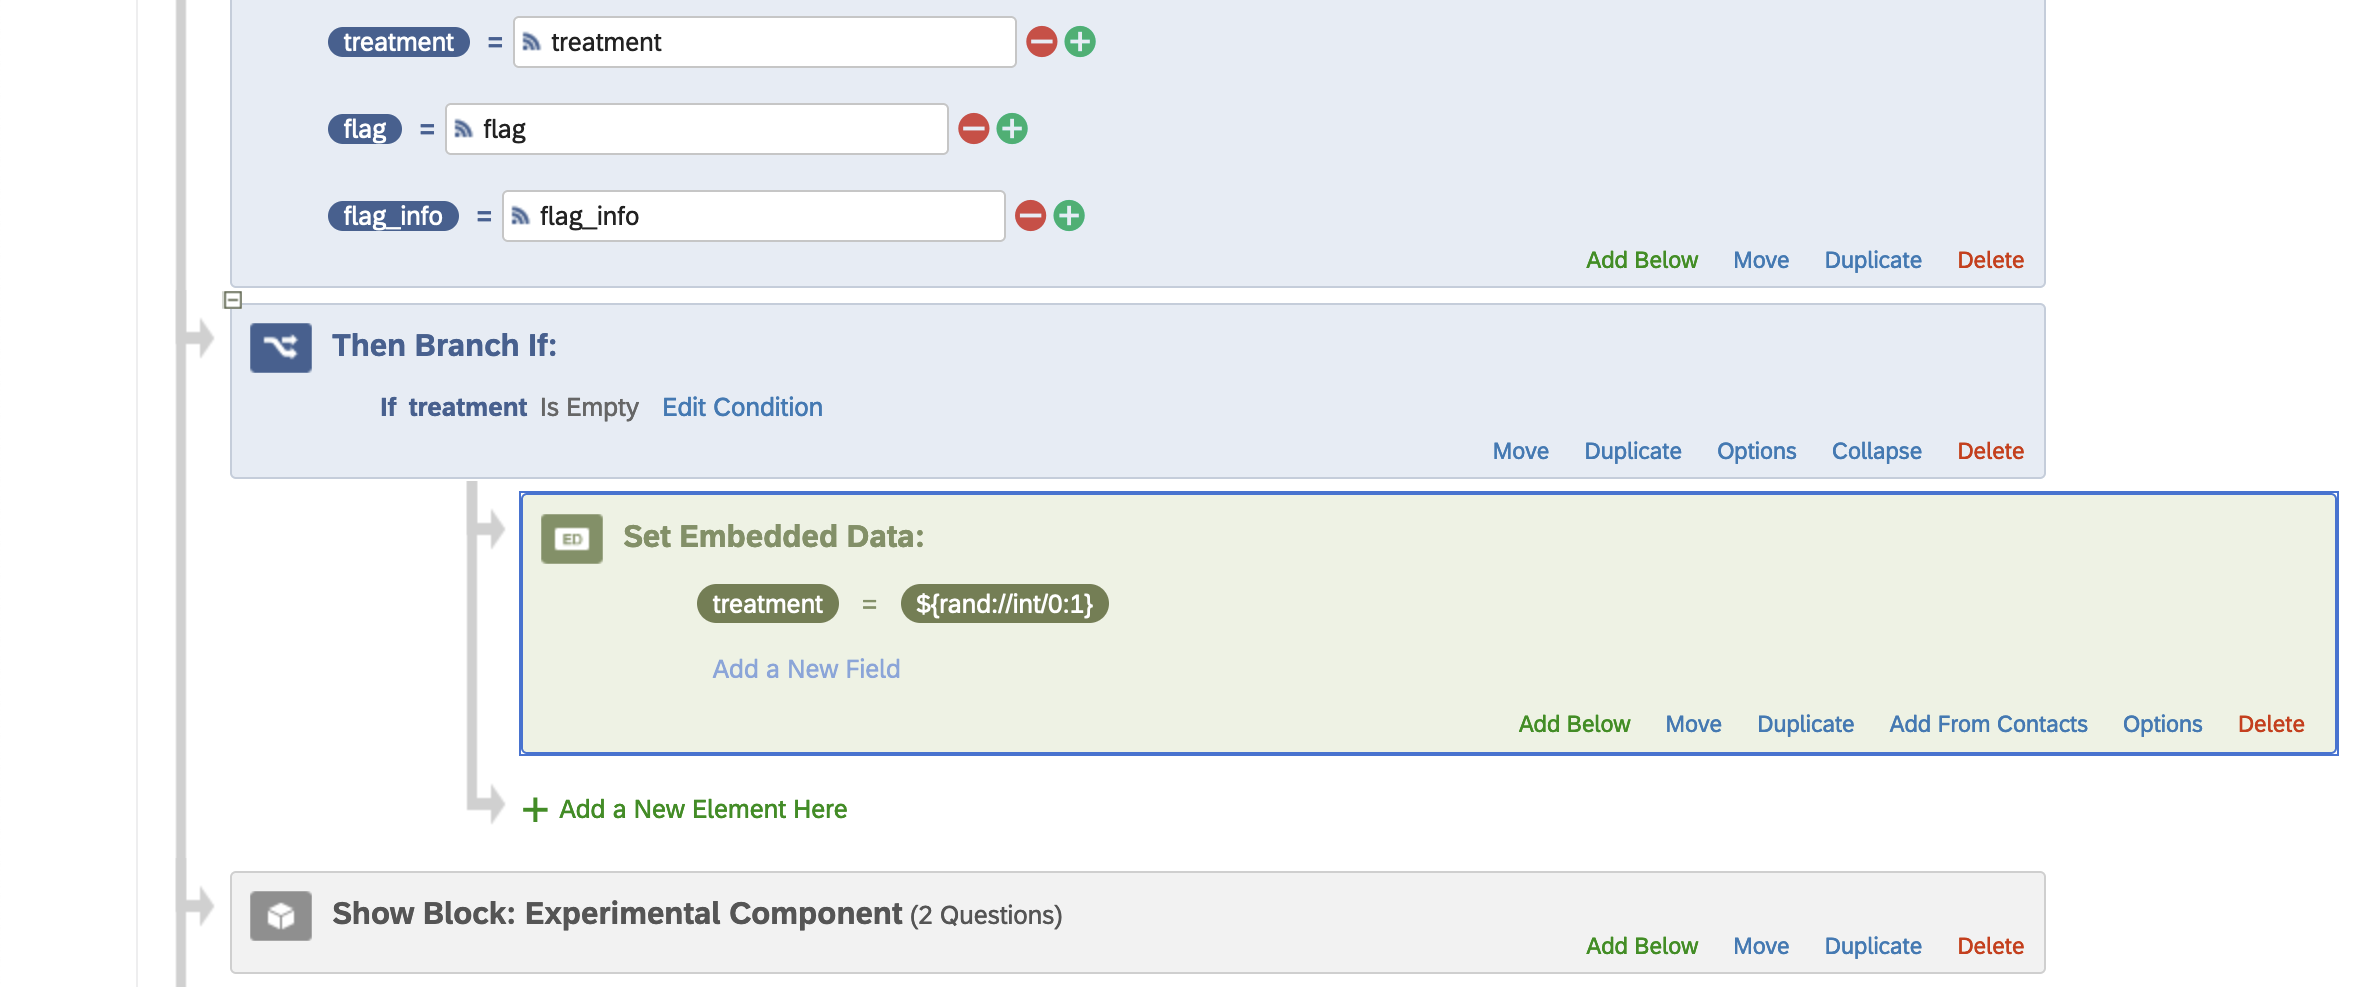
Safeguarding Your Experiment: In rare cases, a
request from your platform to ExperimentPilot may fail. For instance, because the ExperimentPilot server or
intermediary servers did not respond in time. While unlikely, to ensure that randomization is not
compromised, we recommend adding a simple randomization routine right after the call to ExperimentPilot that
kicks in whenever there is an empty treatment response from the web request. This way, even if treatment
assignment through ExperimentPilot fails for some observation, it will still be randomly assigned a treatment.
In Qualtrics, a simple way to accomplish this is to add a branch component after the web service component that is triggered if the treatment field is empty. Then, inside the branch, add an Embedded Data component, click on "Create New Field or Choose From Dropdown..." and write "treatment" or whatever name you gave the embedded data field that holds the treatment assignment. Next, click on "Set A Value Now", select "Insert Piped Text", then "Random Number", and then select "Integer", set "Min" to 0 and "Max" equal the number of experimental groups minus 1, so in our case 1. Finally, click insert.
5. Test Setup
Before launching your experiment, you should test your setup. The specifics of how to do so differ across platforms (and personal preferences), but should involve making sure that ExperimentPilot is receiving data from your platform and returning valid treatment assignments. For instance, you may want to consider the following test flow:
- Generate Observations: Follow whatever method you usually use to test your experiments. For instance, in the case of a survey experiment, you may click through the survey a few times. (In Qualtrics, you can also automatically generate test responses. However, in our own tests, we noticed that Qualtrics does not reliably save embedded data, so this mode is not ideal for troubleshooting.)
- Check Dashboard: After having generated some responses, return to your ExperimentPilot dashboard and make sure that all observations were registered by looking at the observations box in the data dashboard (see the next section for more discussion on the dashboard monitoring tools).
- Check Collected Data: To make sure that the response from ExperimentPilot was processed correctly by your platform, check the embedded data saved for each observation. In Qualtrics, this can be done by going to the Data & Analysis tab and looking at the embedded data associated with each survey response. The "treatment" field should always be a number between 0 and the number of groups minus 1, the "flag" field should equal 0 and the "flag_info" field should say "Success".
-
Trouble-shooting: If one of your checks above fails, for instance
because you cannot see any data in the dashboard or because some experimental components are not reached, you
can use the "flag" and "flag_info" fields to gain insight into the cause of the problem. The flag field takes
one of three values.
- flag = 0. The request was successfully processed. In this case, flag_info = "Success". A correctly blocked treatment assignment is returned.
- flag = 1. The request correctly reached the server, but there were issues in processing the parameters. For instance, not all covariates registered for the experiment could be found in the request, or a continuous covariate could not be coerced to numeric. The "flag_info" field will provide more detailed information on what type of error was encountered. Note that an unconditionally randomized treatment assignment is still returned, but no blocking takes place.
- flag = 2. The request reached the server, but the request could not be matched to a registered experiment. This usually indicates that you misspelled the experiment identifier component of the request URL in the web server component. In this case, the treatment assignment is empty.
- Clean Up: Once you are satisfied with your setup, make sure to delete all data created during testing by clicking on Clear Data in the top right corner of your experiment dashboard page. This will clear all data collected by ExperimentPilot for this experiment, but won't delete the experiment itself.
6. Launch And Monitor
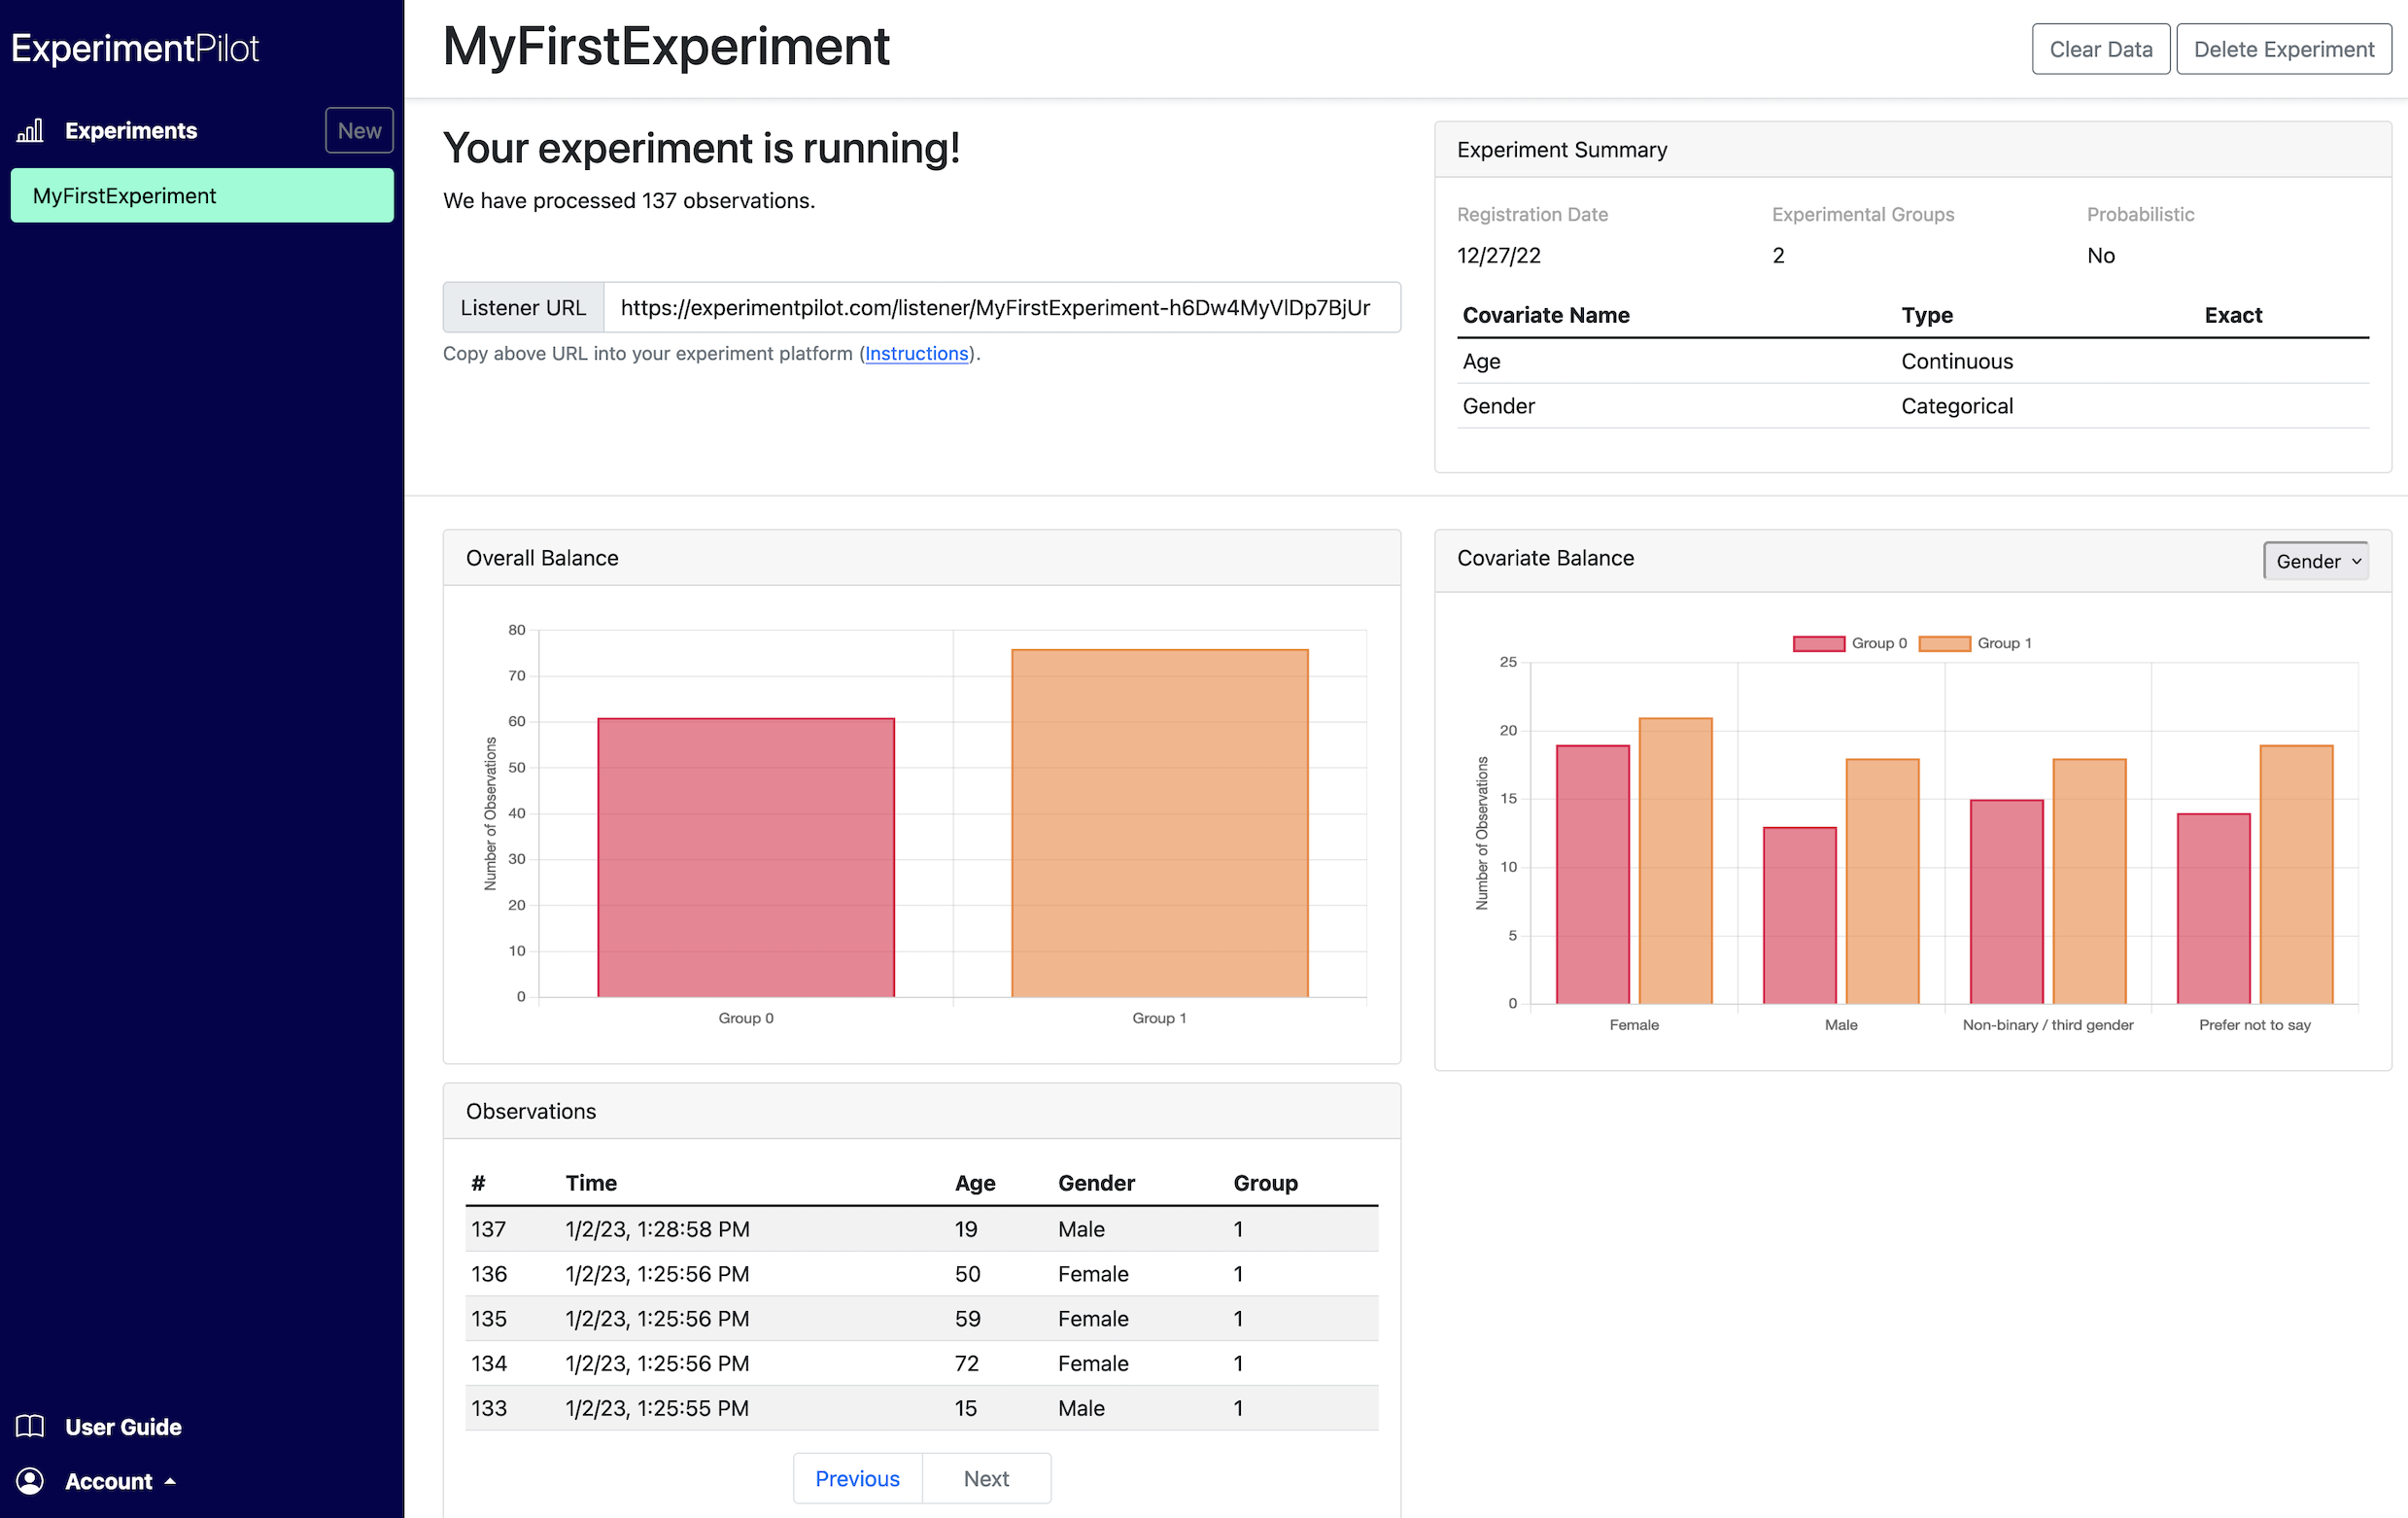
If you are satisfied with your setup you can launch the experiment. You can use the ExperimentPilot dashboard to monitor the progress of your experiment. Once the first observation is collected, the dashboard will display several diagnostic charts and tables:
- Overall Balance: Displays how many units have been assigned to each experimental group so far.
- Covariate Balance: Displays balance across groups at the covariate level. Use the dropdown to select which covariate you want to view. For categorical covariates, the chart displays the number of observations in each group for each category. For continuous covariates, it displays the mean value in each group.
- Observations: Displays processed units in tabular form, including time of processing, covariate values and assigned treatment group.